TOLL FREE: 1 855 TRUE SKY (878 3759)
On this page:
Often within the budgeting process your organization may mandate that certain targets be met, that entries must fall within certain parameters or that values outside of the norm should be investigated. Within True Sky, Template Designers have the ability to create validation rules unique to your organization.
These validation rules can be very broad or very specific and vary across organization and business processes. Validations can be configured to provide warnings/guidance/alerts or can be implemented to even prevent Assignment submissions.
Validations can be triggered in numerous ways:
After Retrieve, Before Save and After Save will all initiate automatically after you either retrieve date, save data (but before the data is committed to the database) or after the save of data has been completed.
However, for “On Demand” validations, simply press the “Validate” button in the True Sky Ribbon Bar and the Validation alerts Pane will appear providing you with more details about the situation. Selecting any alert in the Validations Alert Pane will move the cursor to the section of the Worksheet that meets or does not meet the predefined validation criteria. Changing your data and closing and reopening the Validations Alert Pane will clear the alerts.
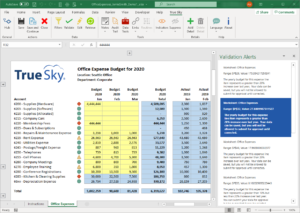
Data Validation Alerts Pane
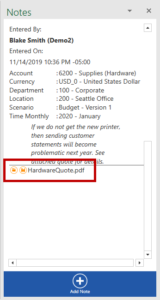
Notes are designed to allow your organization to capture qualitative information along with the traditional quantitative data normally associated with performance management. The goal of the Notes function is to make the process more collaborative while avoiding endless emails, telephone calls and shared drives. Notes, accompanied by Attachments if desired, can be added to any True Sky cell.
To view a Note, select any True Sky cell and press the “Notes” button in the True Sky Ribbon. The Notes Pane will open on the right side of the screen.
In the Notes Pane you will see for which intersection the Note was entered, who created the Note, when the Note was created and the Note itself. You will also see an icon if any Attachments are associated with the Note.
To add a new Note, perform the following steps:
NOTE: Simply pressing the “Attach” button after typing in a Note and/or adding an Attachment will not save the item to the database. The True Sky ”Save” button must be pressed.
NOTE: Attachments can be viewed or downloaded by clicking on the icon next to their name in the Notes Pane. Due to security concerns, Excel Workbooks that are attached cannot be opened directly, they must first be downloaded and then opened.
NOTE: Clicking on the “DOWN ARROW” on the Notes button will provide three different options for displaying indicators related to Notes. The “Simple” option will attach a small red triangle in the upper right cell of any intersection where a Note is present. The “Standard” option will display the triangle and an in-Worksheet popup containing abbreviated information for any Notes entered. The “Detailed” option is similar to the “Standard” option but contains more details.
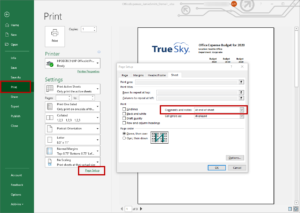
NOTE: Notes can be printed by activating the Notes Indicator and selecting the option to print “Comments and Notes” when configuring print options under “Page Setup” within Excel.
Open or Download Image Buttons
Printing Notes
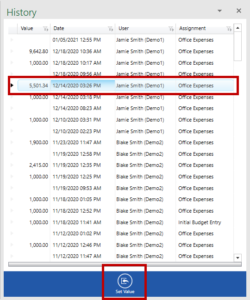
In any multi-user environment it is advantageous to have an audit trail of activity. When you retrieve data in True Sky only the last entered value found in the database is displayed. However, True Sky tracks every instance of data entry and tags each with the data and time changed, the name of the user who entered the data and if applicable the Assignment or process that was used to change the data. To see the history of these changes, select any True Sky cell and press the Audit Trail button from the True Sky Ribbon Bar.
The History Pane will open showing all the changes to the data over time for that particular intersection of data. If desired, you can revert to a prior value by simply highlighting the appropriate entry in the list and pressing the Set Value button.
History Pane and Set Value Button
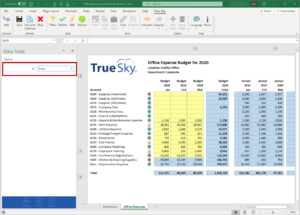
The Data Tools Pane provides you the ability to quickly manipulate data in bulk within a True Sky Worksheet without having to resort to changing individual cells one at a time. Data Tools allows you to perform the following:
The following steps and screenshots illustrate how you would spread a value of $12,000 over a 12-month period based on the prior year’s actuals:
NOTE: In the Data Tools the “Increase” button will increase the selected cells by the value or percentage entered or by the spread method selected. The “Decrease” button will decrease the cells by the value or percentage entered or by the spread method selected. The “Replace” button will clear the existing values and replace them with the appropriate values based on the value or percentage entered or by the spread method selected.
Data Tools Pane on Open
Indicators are a helpful feature that enable you to locate cells that have a particular characteristic. The types of indicators are Details (Line Item Details exist), Rollups (summation of multiple Dimension Members), Read Only (not editable) and Changed (edited but not yet saved). They can be identified as follows:
| Indicator | Color and Shape | Location |
| Details | Blue Square | Upper Left Corner |
| Rollups | Black Square | Lower Right Corner |
| Read Only | Light Red Square | Lower Left Corner |
| Changed | Blue/Grey Star | Left Center |
To show one or more Indicators, perform the following steps:
If desired, you can suppress rows and/or columns that contain all null values (no data present in the database) or all zero values (the number zero is stored in the database) in order to reduce the number of rows and/or columns displayed on the screen. To use the Suppress feature perform the following steps:
NOTE: For a row and/or column to be suppressed it must be zero or null across all cells displayed on screen.
Links allow Template Designers to provide you with quick access to additional information that may be assistance during date entry or for analysis. Two types of links are supported – URL and Query. A URL type link will launch your default web browser and take you to a website determined by the Template Designer. A Query type link will open a pop-up window and return data pulled from a database, such as your ERP or CRM system. Query type links also have the added ability of additional sorting, filtering, grouping and searching options to assist with analysis. URL type links are limited to what the website you are being directed to supports.
Routines are similar to Links but are designed to allow end users such as yourself to initiate backend processes. Some example of commonly published processes include the copying or seeding of budget data, bulk manipulation of data, initiating integrations and adding “on the fly” new master records to the system.
Links and Routines will be configured to your organization’s specific needs and may be different by user group within your organization.
When configuring Links and Routines, the Template Designer can choose to pass parameters from the True Sky Worksheet into the URL address or into the Query based on the location of your cursor. For instance, a Query could be run and only return data related to the specific customer that has been selected in the Filter Pane and for the specific product that your cursor has selected.
NOTE: Specific Links and/or Routines can also be tied to specific True Sky intersections, therefore depending on the location of your cursor, your choice of Links or Routines may vary as may what each Link or Routine actually does.
NOTE: If no Links and/or Routines have been published then these two buttons will be unavailable. Also, if a Link or Routine is only available when in a specific intersection these buttons will be unavailable until you have selected a record in that intersection.
NOTE: There are two different types of Query Links – With Summaries and Allow Excel Interaction. With Summaries will allow greater filtering and summation options while Allow Excel Interaction will allow you to move back and forth between the query results windows and Excel.
NOTE: Query Links interactivity includes sorting highest to lowest and lowest to highest by clicking on the column name, reordering columns with click and drag, displaying totals by clicking on the summation icon and filtering by clicking on the filter icon. Data can also be grouped by dragging a column up into the “group by area.”
Links Button with Multiple Links and Retrieve Options
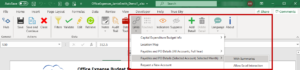
Links Button with Multiple Links and Retrieve Options